
There is one question almost every NPS investor eventually types into a search bar: “What return does NPS give?”
The honest answer is that no one can tell you — not because the data is hidden, but because NPS does not work like a fixed deposit or even a mutual fund with a single NAV.
If you are new to NPS and want to understand how the scheme works before diving into returns, start with the complete NPS guide covering account types, fund choices, tax benefits and exit rules.
Your return is not waiting to be looked up somewhere.
It is built, over decades, from decisions you make, cycles you happen to invest through, and whether you stay the course when markets get uncomfortable.
This article explains why, and what you should focus on instead.
What PFRDA Actually Discloses
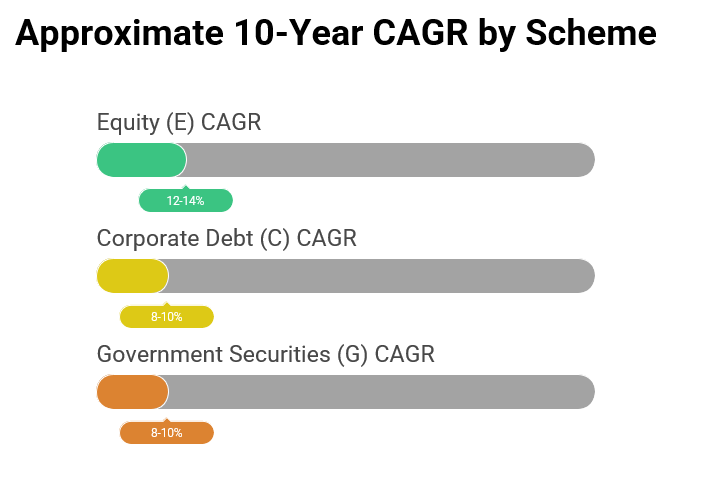
The NPS Trust website publishes NAV-based returns for each scheme —
Equity (E), Corporate Debt (C), and Government Securities (G) —
broken down by Pension Fund Manager (PFM). As of recent data, the broad historical ranges look something like this:
These numbers are real, publicly available, and useful as reference points. But they are not your return.
Here is why.
An NPS investor does not invest in one scheme.
You hold a combination of E, C, and G — and the ratio varies by individual.
Someone with 75% equity and 25% debt will have a very different outcome from someone with equal thirds in all three.
The scheme-level returns are the raw ingredients. Your actual return depends entirely on the recipe — the allocation — and when exactly each ingredient was added.
There is also a timing dimension that no published table can capture.
The same 75/25 equity-debt allocation generates different outcomes depending on whether you started investing in 2010, 2014, or 2020.
Each starting point means a different sequence of market cycles, which is the single most underappreciated variable in long-term investing.
The published data is accurate. It is just incomplete as a proxy for your personal outcome.
Why There Is No Single NPS Return
Three asset classes, not one
NPS puts your money to work across three distinct pools:
| Scheme[Investment Area] | Return range | Key risk | The catch |
|---|---|---|---|
| Equity (E) — Growth engine [Indian stocks] | 12–14% in bull runs; −30 to −40% in crashes | Market volatility | Highest potential — only if you hold through drawdowns. |
| Corp Debt (C) — Stability layer [Company & Institution bonds] | 8–10%; relatively steady | Issuer credit quality | Predictable — but not risk-free. |
| Gilt (G) — Rate-sensitive [Government bonds] | 8–10%; safest on credit | RBI interest rate direction | Safe from default — not from rate cycles. |
All three behave differently across cycles — making a single “NPS return” meaningless without knowing your allocation weights.
Your allocation is yours alone
PFRDA gives non-government NPS subscribers five distinct ways to structure their investment — and the choice between them is the single biggest variable in your long-term outcome.
| Choice type | Variants | Max equity exposure | Who manages allocation | Key caveat |
|---|---|---|---|---|
| Active Choice | Single option | 75% (regulatory cap) | You — reviewed and adjusted manually | Requires annual review as goals evolve |
| Auto Choice — LC-25 | Conservative lifecycle | 25% at youngest age, declines with age | Automatic (age-based glide path) | Lowest equity runway — suited for low risk tolerance or near-retirement investors |
| Auto Choice — LC-50 | Moderate lifecycle | 50% at youngest age, declines with age | Automatic (age-based glide path) | Default option for most investors; balanced hands-off approach |
| Auto Choice — LC-75 | Aggressive lifecycle | 75% at youngest age, declines with age | Automatic (age-based glide path) | Suited for younger investors comfortable with higher volatility |
| MSF (Multiple Scheme Framework) | Multiple schemes per PFM; high-risk variant allows up to 100% equity | 100% | Fund manager rebalances based on market conditions — not the investor | Available only for new contributions from Oct 2025; higher fees (up to 0.30% vs 0.03–0.09% for common schemes); non-government subscribers only |
MSF is a significant structural upgrade — but the fee difference over 25–30 years warrants careful consideration before switching new contributions away from common schemes.
Once you understand how your corpus is built, the next question is what happens to it at 60. PFRDA’s new Retirement Income Scheme changes that answer significantly — here is how NPS RIS manages your corpus after retirement.
Why Two NPS Investors Never Get the Same Return
Yes, that is a sharper and more honest framing. Here is the table restructured around that point:
| Investor A | Investor B | Investor C | |
|---|---|---|---|
| Age at start | 30 | 30 | 30 |
| NPS structure | MSF (100% equity) | Active Choice (75% equity) | Auto Choice LC-25 |
| Monthly contribution | ₹10,000 | ₹10,000 | ₹10,000 |
| Horizon | 30 years | 30 years | 30 years |
| Assumed blended CAGR | ~13% | ~11–12% | ~8–9% |
| Projected corpus | ~₹3.5–4 crore | ~₹2.3–3.5 crore | ~₹1.4–1.7 crore |
The single takeaway:
Three investors. Same age, amount,product and 30 years.
Three completely different outcomes — ranging from ₹1.4 crore to ₹4 crore. This is why there is no single NPS return.
The return is not a property of the product. It is a consequence of the structure you choose — and whether you stay with it.
The PFM Performance Trap
Every few years, a PFM rises to the top of the NPS return tables. It gets discussed in personal finance communities. Investors switch to it. Then, quietly, the rankings rotate.
This is not random. NPS PFM rankings are largely cycle-driven:
- PFMs with higher equity exposure and aggressive stock selection lead during bull markets
- PFMs with higher gilt allocation benefit when interest rates fall
- More conservative allocations hold up better during corrections
When the Nifty was delivering 15–18% annually between 2017 and 2020, equity-heavy PFMs looked exceptional.
When rising rates in 2022 pressured both equities and gilts, the same PFMs fell in the rankings. No one was doing anything wrong. The cycle simply turned.
Chasing the top PFM is structurally likely to underperform staying put.
You enter after the outperformance has happened. You exit (or switch) during the trough, often right before a recovery.
The decision feels rational each time — it is based on real data — but the sequencing is systematically backwards.
PFRDA’s own historical disclosures make this pattern visible to anyone willing to look at 5–7 years of rankings rather than just the last 12 months.
What Actually Drives Your NPS Outcome
There are three genuine levers — and they matter in descending order of impact:
Asset allocation — the primary lever
Your allocation across E, C, and G determines the ceiling of your return. The equity scheme has delivered 12–14% over the long run. The more of your corpus that sits in equity, and the longer it stays there, the higher the ceiling. Which PFM you choose matters far less than this single decision.
What most investors don’t realise is that this allocation shift continues automatically into retirement under the new NPS RIS structure — see how PFRDA’s Retirement Income Scheme manages the glide path after 60.
One caveat: allocation only works if it is held. A well-chosen allocation abandoned during a correction is worth less than a conservative allocation stayed with for 30 years.
Market cycles — accept them, do not react to them
You cannot choose which cycles you invest through. What NPS already does for you — through mandatory monthly contributions — is rupee cost averaging. Every downturn means your ₹10,000 buys more units at lower NAVs. The correction is not a threat to your portfolio. It is the mechanism working as intended. The only way to turn it into a threat is to stop contributing or switch schemes at the bottom.
Behaviour — where most returns are actually lost
In March 2020, NPS equity NAVs fell 35–40% in weeks. Investors who switched from E to G locked in that loss permanently. By December 2020, the equity scheme had fully recovered. Investors who did nothing captured the entire recovery — without any analysis, any timing, or any market expertise. They simply did not act.
Over 25–30 years, there will be four or five moments like this. What you do in those moments — not which PFM you picked, not how often you rebalanced — is the single biggest determinant of your actual realised return. Behaviour is not a soft factor. It is the return multiplier.
Choosing Your NPS Structure: Start With Behaviour, Not Features
Most investors approach this decision the wrong way — comparing Auto Choice, Active Choice, and MSF as if they are products with different features. They are not. They are structural expressions of a prior decision: what kind of investor are you at this stage of life?
The RSW framework puts it clearly: behaviour defines intent, structure defines implementation. Until you know the first, the second is guesswork.
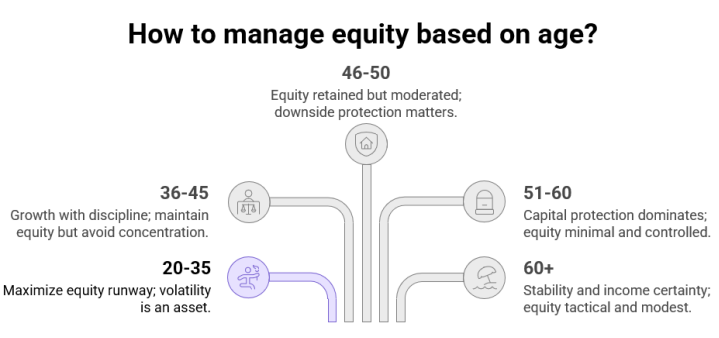
Step 1: Identify your behavioural stage
Step 2: Identify your temperament
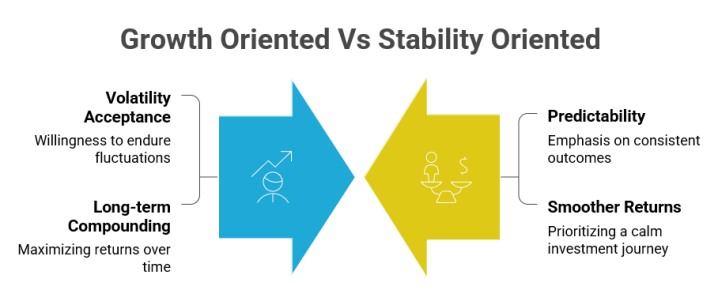
At every life stage, investors fall into one of two orientations — and both are valid:
- Growth-oriented: comfortable accepting volatility for long-term compounding
- Stability-oriented: prioritises predictability and smoother return experience
Step 3: Match to structure
Once stage and temperament are clear, structure selection becomes straightforward:
| Structure | Best Matched To | Who manages allocation | |
|---|---|---|---|
| Auto Choice LC-25 | Stability-oriented, 46+ | 25% declining with age | Automatic |
| Auto Choice LC-50 | Balanced temperament, any age | 50% declining with age | Automatic |
| Auto Choice LC-75 | Growth-oriented, under 45 | 75% declining with age | Automatic |
| Active Choice | Growth or stability-oriented investors comfortable with annual reviews | 75% fixed | You |
| MSF | Growth-oriented investors wanting maximum equity precision across fund houses | Up to 100% | Fund manager within scheme mandate |
The question that cuts through all of this:
Not “which structure has the best return?” but “which structure can I stay committed to through a -30% equity drawdown without switching to gilt?”
That answer — honest, not aspirational — determines your structure. Everything else is secondary.
For a deeper read on how behavioural stage maps to PFM selection and execution style, the full RSW framework is covered here: Designing Your NPS Strategy — Beyond Returns and Rankings
The Question Worth Asking
Instead of “what return will NPS give me?”, the more useful question is: “what allocation can I stay committed to for 25 years, through corrections, career changes, and market headlines?”
That question has a knowable answer — one that is specific to your income, your risk tolerance, and your years to retirement.
The first question does not have an honest answer, because the return is not pre-set. It is made, over time, through the combination of your allocation and your behaviour.
And when that structure finally reaches retirement, PFRDA has now introduced a framework to manage the decumulation phase with equal discipline. Read how the NPS Retirement Income Scheme works after 60.
NPS, at its best, is not a product that generates a return.
It is a structure that gives you the conditions to let compounding work — if you do not get in the way.
Book your free one-hour wealth planning call →

Founder R S W Personal Finance Advisors.
B.E , PGDM [Marketing] ,
Chaterered Wealth Manager,
PMS Disributor, Mutual Fund Distributor.
Passionate about Personal Wealth Management. Practising 4+ Years.
Read more “About Me”